Figure 2.
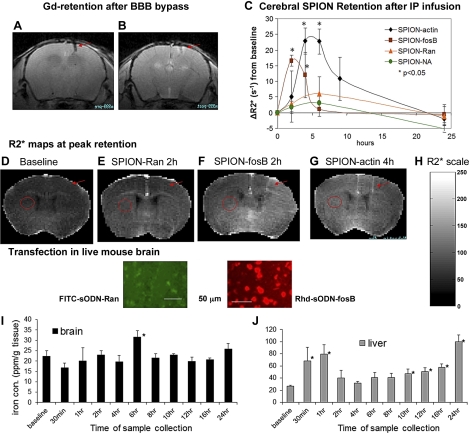
Global distribution of SPION-sODN and correlation with iron content after BBB bypass. A, B) Gd-enhanced MRI images acquired before (A) and after (B) administration of Gd (followed by MRI within 30 min) to show BBB bypass (arrows). C) Time course of R2* values above baseline (ΔR2*) after SPION-sODN. D–H) Representative R2* maps from baseline (D), SPION-Ran (E), SPION-fosB (F), and SPION-actin (G) at peak hours after delivery, with scale bar for R2* values (H). Histological striatal sections examined by postmortem optical microscopy showed retention for FITC-sODN-Ran (green; E, bottom panel) and Rhd-sODN-FosB (red; F, bottom panel). I, J) Iron content in the brain (I) and liver (J) at various time points (average±se of n=3/time point) after SPION-actin.

