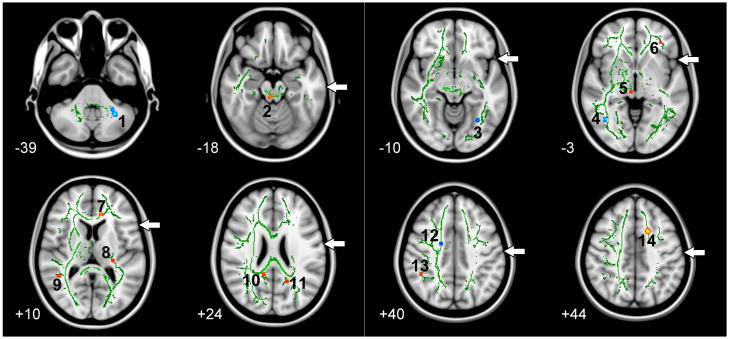
Fig. 2.
Tract-Based Spatial Statistics (TBSS) analysis of the pre- to post-rTMS changes in fractional anisotropy (FA). Clusters in blue represent decreases, while those in red/yellow represent increases in FA (only changes significant at uncorrected p<0.001 are shown). The numbers (1–14) correspond to the clusters described in Table 2. The green skeleton represents the center of white matter tracts common to the group with FA ≥ 0.2 and is superimposed on the standard MNI152 T1-weighted anatomical image. The white arrows indicate areas with breaks in the green skeleton that represent damaged white matter not included in TBSS analysis. The axial slices are displayed in in radiological convention (left on the picture is right in the brain) and range in MNI coordinates from z = -39 (top left) to z = +44 (bottom right).

