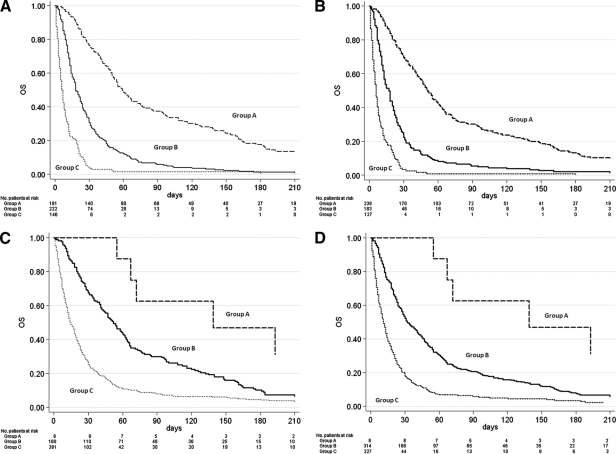
Figure 2.
Overall survival curves for the low (group A), intermediate (group B), and high (group C) risk groups defined by (A) Palliative Prognostic Score (PaP Score), (B) Delirium-Palliative Prognostic Score (D-PaP Score), (C) Palliative Prognostic Index (PPI), and (D) Palliative Performance Scale (PPS). All four models discriminated well, and log-rank tests were all highly significant (p < .0001). Abbreviation: OS, overall survival.

