
Figure 1.
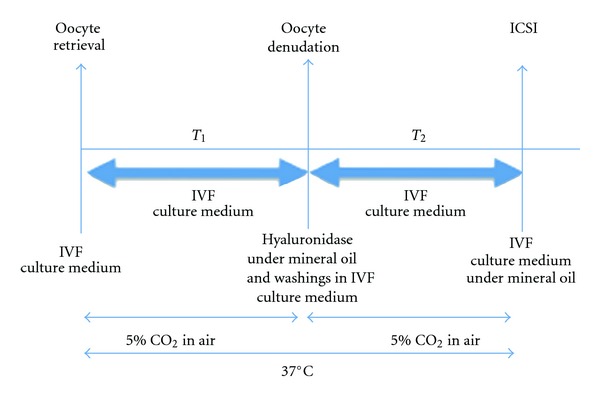
Schematic representation of the two timings T 1 and T 2. T 1: Time elapsed between oocyte retrieval and denudation. T 2: Time elapsed between oocyte denudation and ICSI.
Official websites use .gov
A
.gov website belongs to an official
government organization in the United States.
Secure .gov websites use HTTPS
A lock (
) or https:// means you've safely
connected to the .gov website. Share sensitive
information only on official, secure websites.
Schematic representation of the two timings T 1 and T 2. T 1: Time elapsed between oocyte retrieval and denudation. T 2: Time elapsed between oocyte denudation and ICSI.