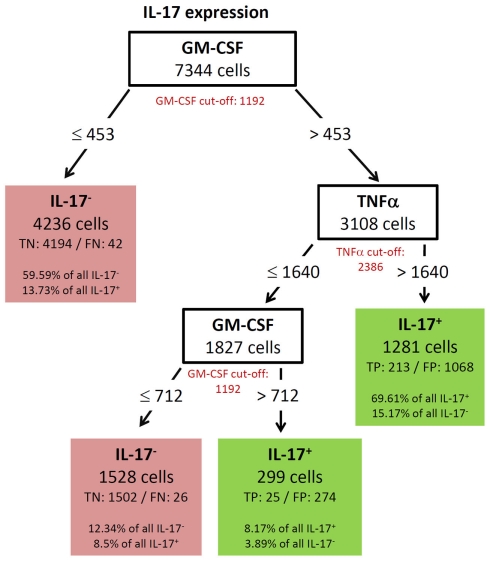
Figure 9.
Best decision tree for the classification of cells as positive or negative for IL-17 expression. Cells are first classified based on the MFI values of GM-CSF. The red colored GM-CSF cut-off value indicates that the split value is high below the cut-off value. The cells routed to the left node do not express GM-CSF and this value split captures 59.59% of all IL-17 negative cells and only wrongly classifies 13.73% of the IL-17 positive cells. The next split on the right is on TNF-α, but again the split value is below the cut-off value. The split values of GM-CSF and TNF-α are below the cut-off value and thus not all cells, which are routed down the path to the rightmost leaf express this two cytokines. Nevertheless this leaf correctly classifies 69.61% of the IL-17 positive cells as positive. Only 15.17% of the IL-17 negative cells are wrongly classified in this leaf. Also the last split value again on GM-CSF is below the cut-off value.

