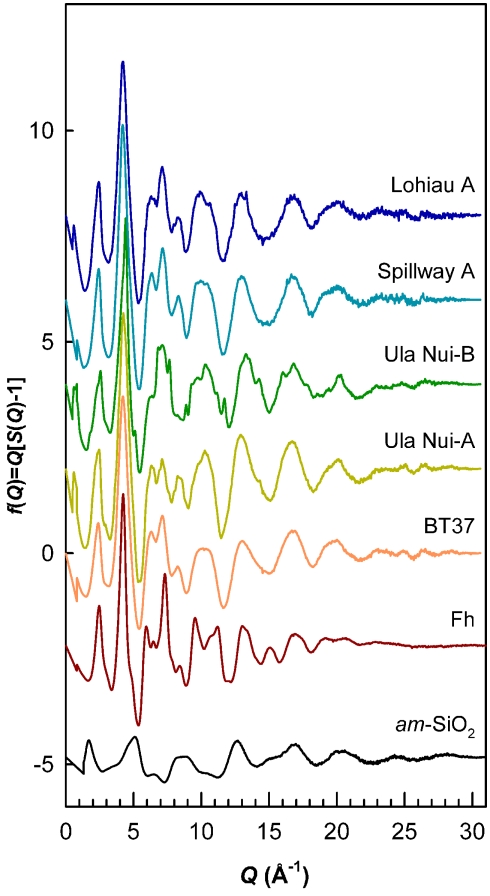
Figure 4.
Reduced structure functions for references of Fh and amorphous SiO2 compared to the five natural samples. Data plotted as f(Q) versus Q (Q = 4πsinθ/λ). Overall, the profiles are similar to the Fh reference but differ in terms of peak broadening and the relative intensities of certain features. Sharp features in Ula Nui-B due to birnessite impurity. These data were truncated at maximum Q-range = 30 Å−1 and Fourier transformed with a Lorch modification function to obtain PDFs shown in Figure 5.

