Figure 2.

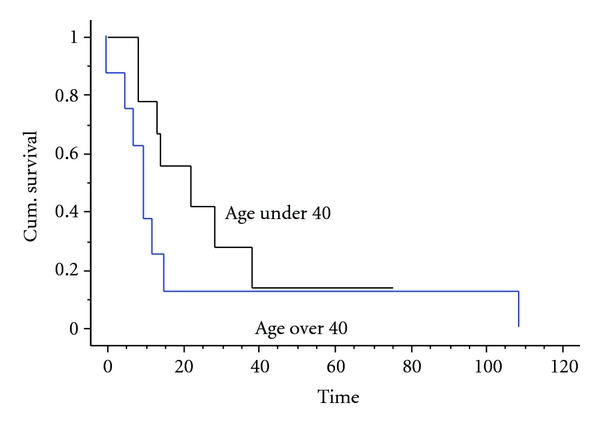
Kaplan Meier survival curve showing the survival of patients split by age group. There is no statistical difference between the two groups, despite the younger group all being treated with chemotherapy (P = 0.17).

Kaplan Meier survival curve showing the survival of patients split by age group. There is no statistical difference between the two groups, despite the younger group all being treated with chemotherapy (P = 0.17).