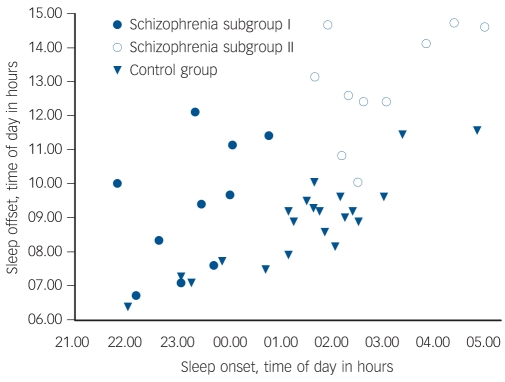
Fig. 2.
Distribution of sleep timing with sleep onset plotted relative to sleep offset in schizophrenia and control group.
Each dot represents a person's average sleep onset/offset time derived from 6 weeks of wrist actigraphy. Schizophrenia subgroup I: sleep onset before 01.00 h, n = 10; schizophrenia subgroup II: sleep onset after 01.00 h, n = 10; control group n = 21.

