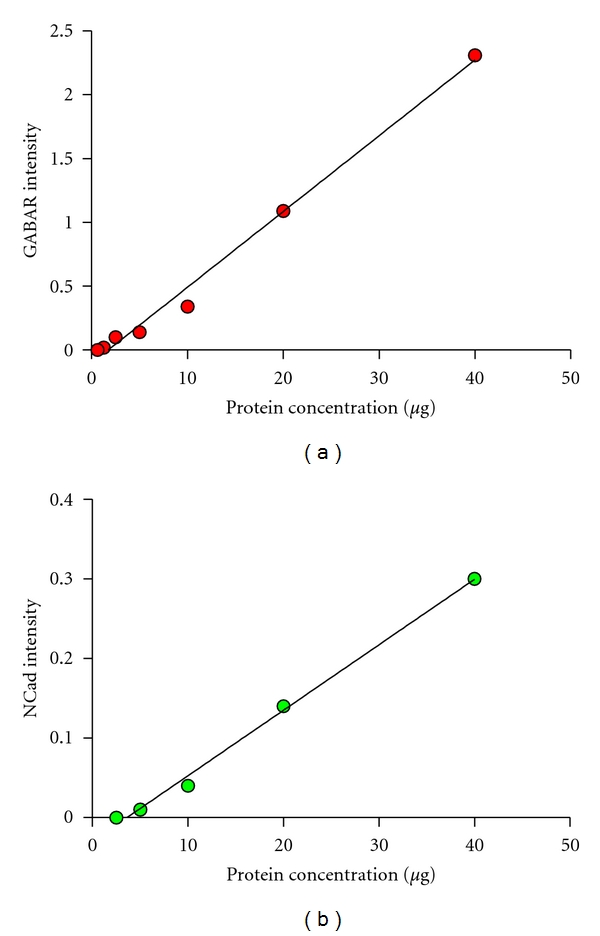
Figure 2.

Quantitative Western Blot linear ranges for each protein. (a) GABAAR protein band fluorescent intensity corresponding to a protein dilution curve, 680 nm laser at a scanning intensity of 4 (R 2 = 0.9916). (b) NCad protein band fluorescent intensity corresponding to a protein dilution curve, 800 nm laser at a scanning intensity of 3 (R 2 = 0.9957).
