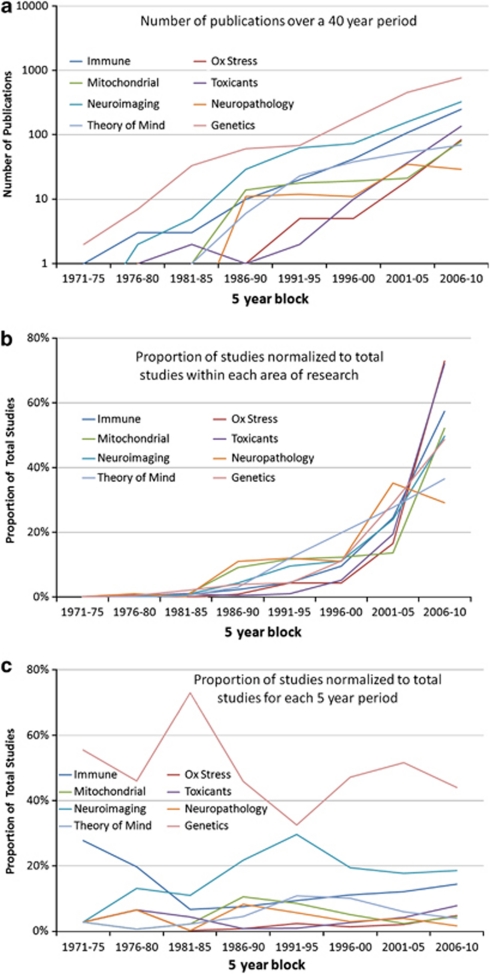
Figure 1.
Graph of publications on autism spectrum disorder (ASD) by type and year of publication. (a) The number of publications in the eight areas per 5-year block on a logarithmic scale. (b) The proportion of publications within each research area normalized by the total number of publications within the specific research area. This allows the relative growth in each research area to be observed. (c) The proportion that each research area accounts for in the total number of publications identified for each specific 5-year period. This allows the relative influence of each area of research to be determined over time.

