Figure 1.

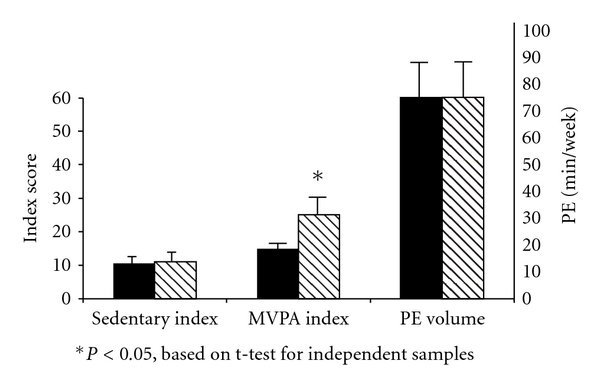
Mean (±SEM) values for the sedentary and MVPA indices and PE volume between obese children with (solid bars) and without (striped bars) insulin resistance.

Mean (±SEM) values for the sedentary and MVPA indices and PE volume between obese children with (solid bars) and without (striped bars) insulin resistance.