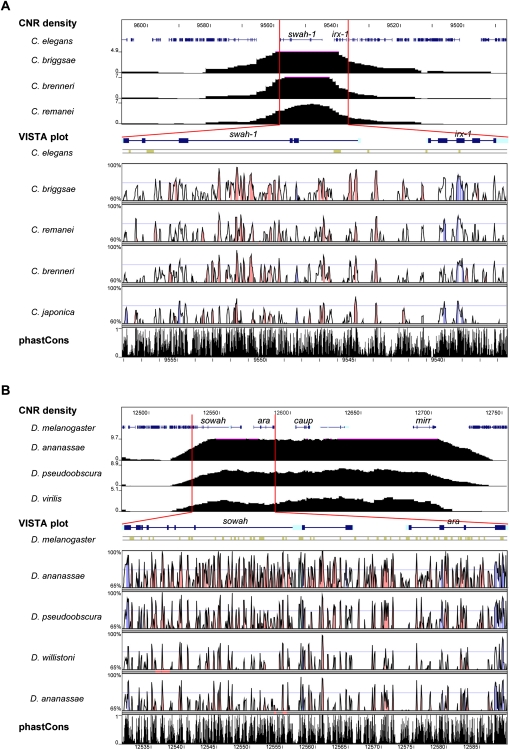
Figure 1.
CNRs in nematode and drosophilid Sowah genes. Ancora plots of CNR density (top), VISTA plots (middle), and phastCons tracks (bottom) of the Irx-Sowah region of nematodes (A) and flies (B). (Red bars) Region depicted in Ancora plots zoomed in on VISTA and phastCons tracks. VISTA colored peaks (blue, coding; turquoise, UTR; pink, noncoding) indicate regions of at least 50 bp and ≥90% similarity (≥85% in the case of Caenorhabditis japonica) in nematodes and 60 bp and ≥90% similarity in flies. Only gene symbols corresponding to Sowah (swah-1 in nematodes) and Irx (ara, caup, and mirr in Drosophila) are indicated. Numbers at the left correspond to the percentage of base pairs covered by CNRs in Ancora plots, percentage identity in VISTA analyses, and conservation scores in phastCons.

