
Figure 5.
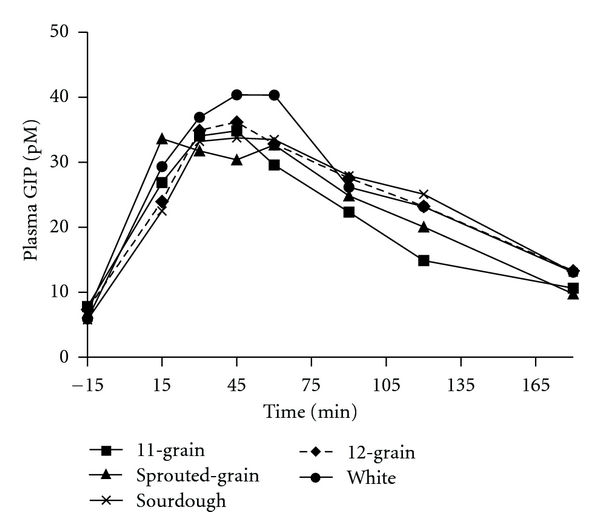
Fasting and postprandial GIP responses to the ingestion of a consistent amount of the test breads. Data are means. Standard errors are not included for clarity, n = 11. Test bread was ingested after collection of fasting blood sample at time point −15 min. A significant overall treatment effect was found (11-grain bread was lower than sourdough (P < 0.008) bread).