
Figure 2.
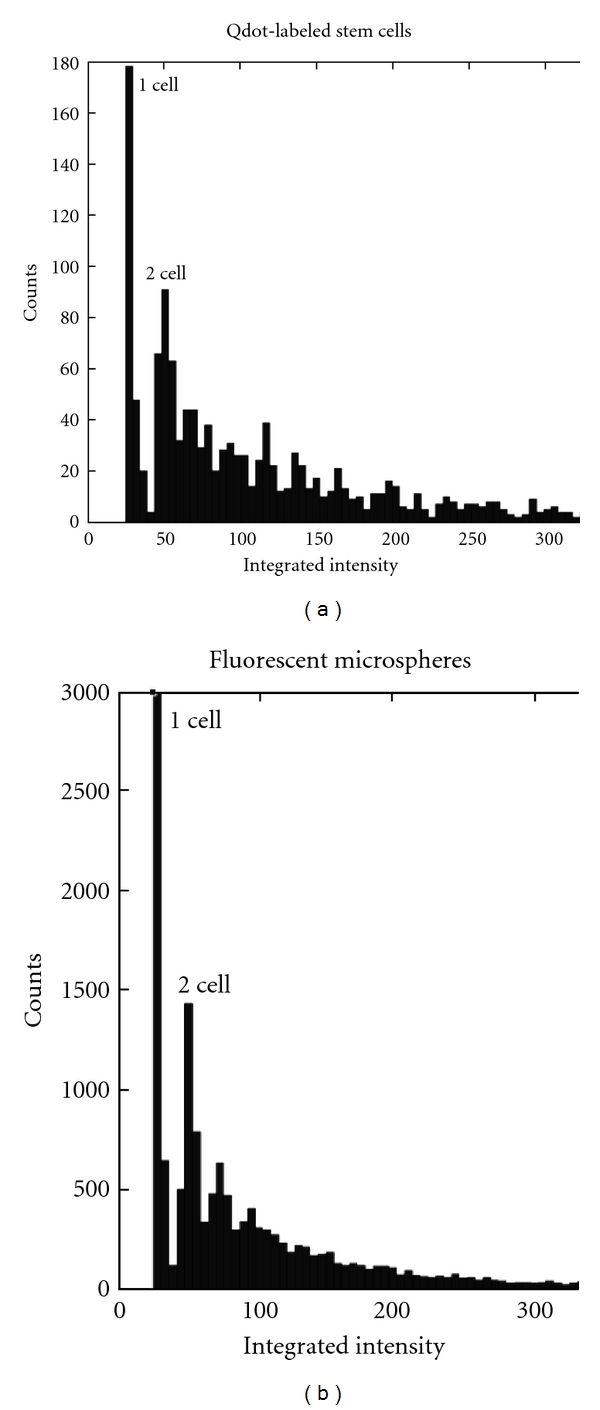
Histograms of the integrated intensity of clusters of fluorescently labeled cells and microspheres. Since cells/microspheres were dispersed, the largest peaks correspond to single cells/microspheres. Note that the next large peak occurs at 2 times the integrated intensity of the first peak, indicating two cells in a cluster. We use values in the “1 cell” peak to estimate parameters for subsequent processing of images.