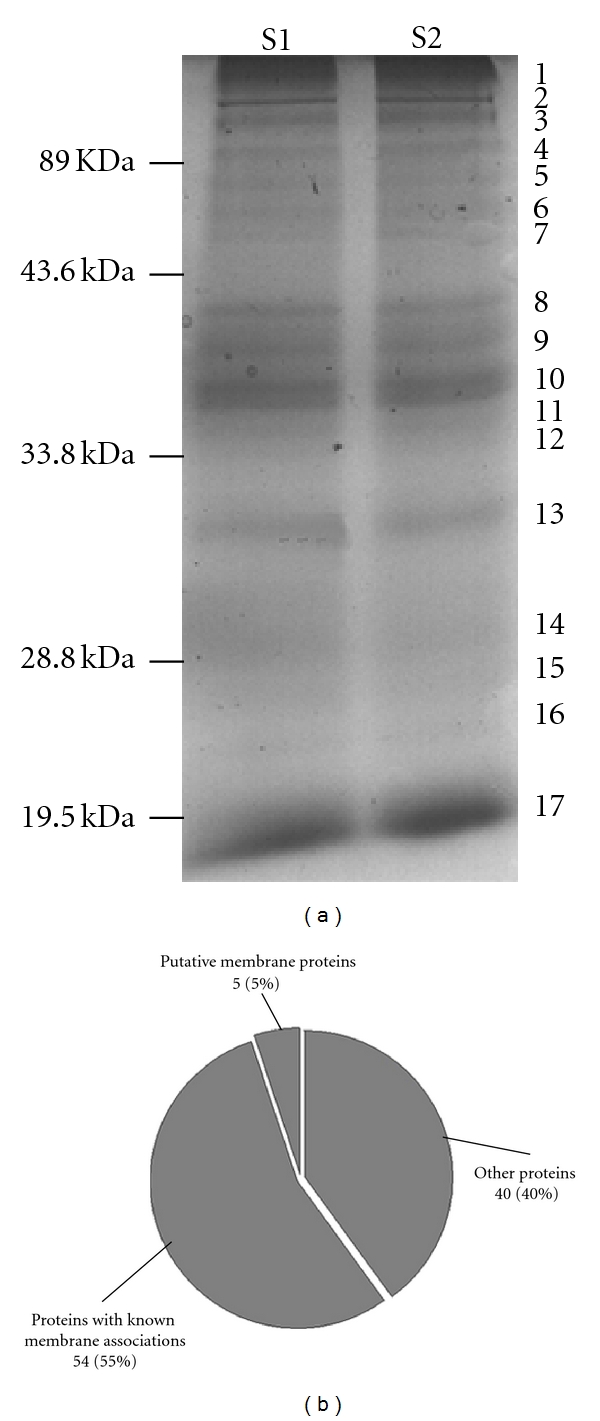
Figure 2.

1DE pattern and membrane-associated characteristic classification of Na2CO3-extracted microsomal membrane proteins. (a) 1DE pattern. Molecular weight markers are shown on the left and bands excised for MS analysis are indicated on the right. Lanes S1 and S2 were loaded with the same protein samples (50 μg per lane). (b) Classification via membrane-associated characteristic. The criteria used for this classification were published reports, annotations in the genome database (http://www.uniprot.org/), and predictions for transmembrane regions (http://www.cbs.dtu.dk/services/TMHMM/).
