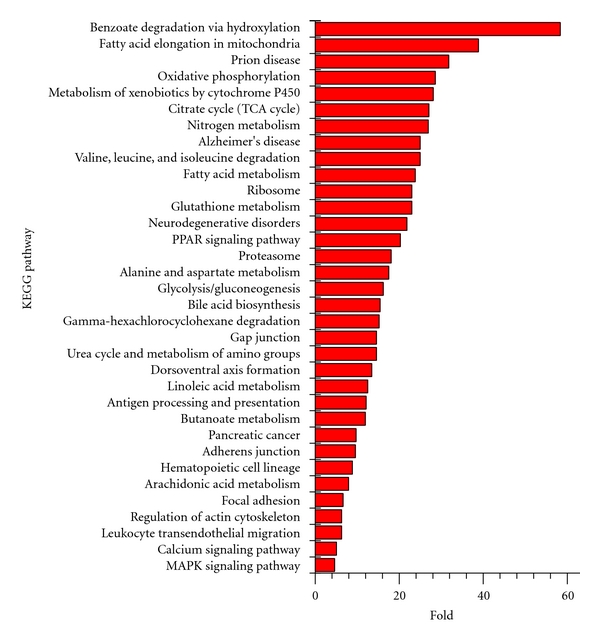
Figure 3.

Significantly enriched KEGG pathways for mouse liver microsome proteins (n = 259) that were derived from 1DE and 2DE strategies. KEGG pathway enrichment analysis was performed using WebGestalt. The pathways having enrichment (P < 0.01) are presented. For each KEGG pathway, the bar shows the x-fold enrichment of the pathway in our dataset.
