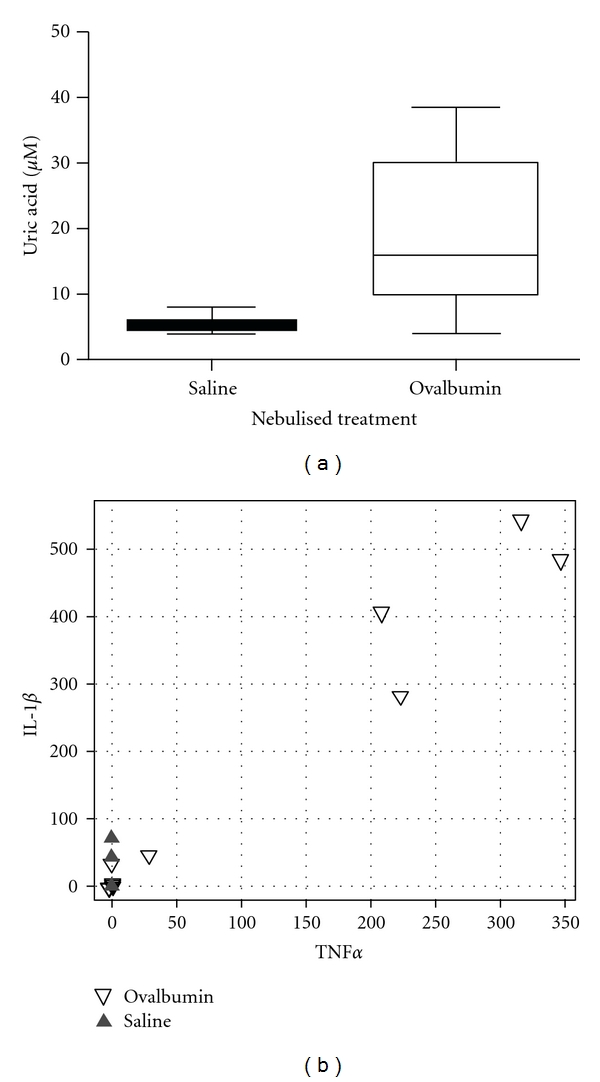
Figure 5.

Increase of uric acid in BALFs (a) and cytokines IL-1β and TNF-α in sera (b) of OVA-treated mice, compared to saline-treated controls. (a) Box plot (showing median, interquartile range, and nonoutlier range) demonstrating that BALF uric acid levels are elevated in OVA-treated mice (n = 8) compared to SAL mice (n = 8), P < 0.001 (Kruskal-Wallis test). (b) Scatter plot of serum IL-1β versus TNF-α levels (pg/mL) in OVA-treated mice (open triangles, n = 8) versus SAL-treated mice (closed triangles, n = 8). High cytokine levels were only observed in the OVA-treated mouse group.
