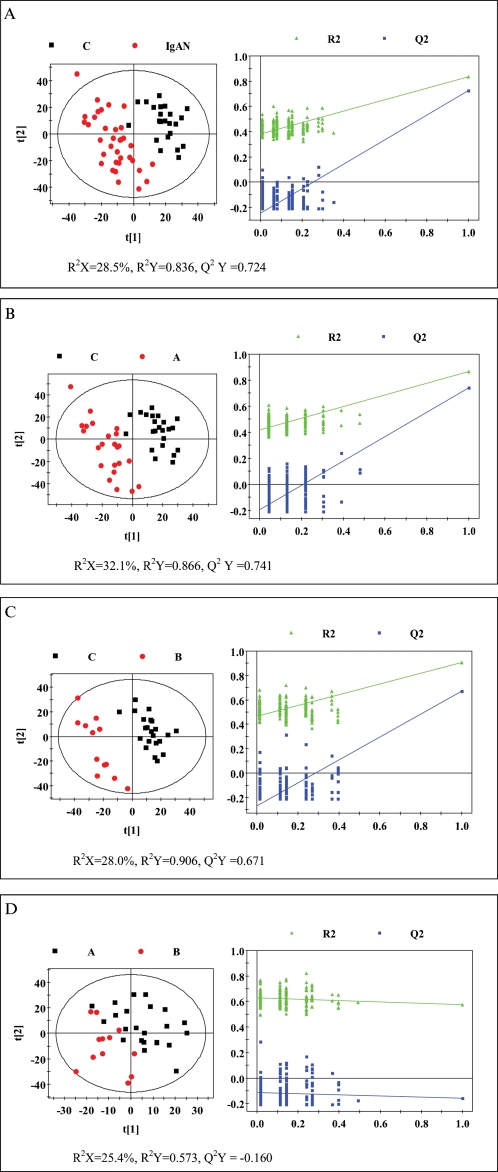
Figure 3.
Cross-validation of partial least squares-discriminant analysis (PLS-DA) models obtained from 200 permutation tests. PLS-DA score plots showing the separation between (a) controls and IgAN patients, (b) controls and IgAN-A patients, (c) controls and IgAN-B patients, and (d) IgAN-A and IgAN-B patients.

