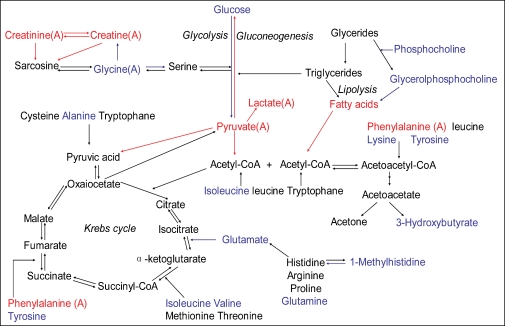
Figure 5.
Summary of the metabolic pathways in which the metabolites described in this article are involved. Red indicates enhanced metabolite levels, blue indicates reduced metabolite levels, and black indicates metabolites not found or not identified. (A) represents the changes only found in the IgAN-A group.

