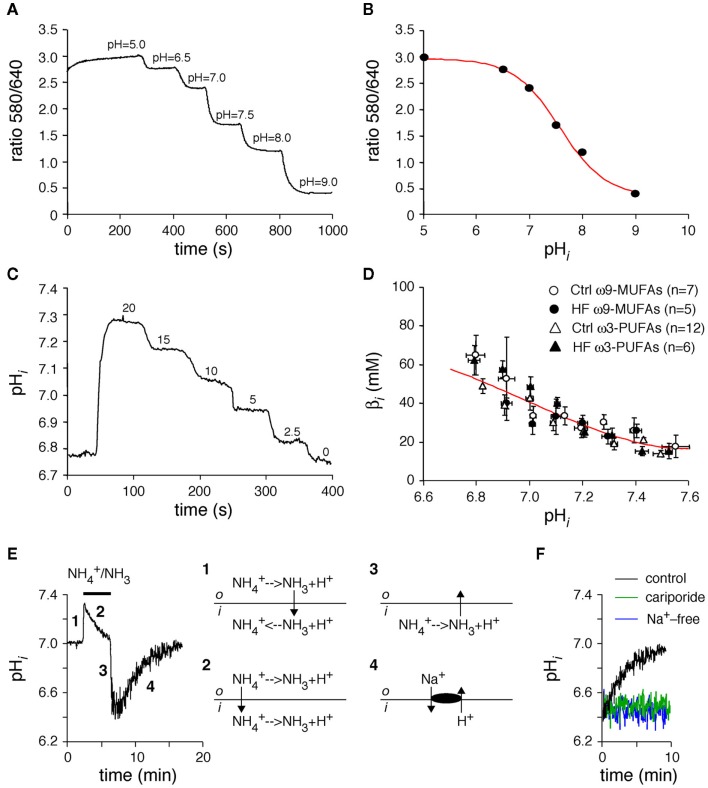
Figure 1.
(A,B) In vivo calibration curve of SNARF-AM. To determine calibration curve myocytes were loaded with SNARF-AM and superfused in presence op nigericin with several high K+ solutions at various pHo values (A). When the external and internal K+ free concentrations are equal, pHi is the same as pHo. The calibration curve (B) was obtained by plotting the ratios (580/640) against the corresponding pHo. The red line represents a Henderson–Hasselbalch fit through these data, which revealed a maximum ratio of 2.97 and a minimum ratio of 0.36 and a pKa of 7.57. (C,D) Determination of the intrinsic sarcoplasmic buffer power (βi). Typical example of the “stepwise reduction in extracellular NH3/NH4+ approach” in a myocyte isolated from a healthy, ω3-PUFA fed animal (C), and pHi–βi relationships of ω3-PUFA and ω9-MUFA myocytes of both healthy rabbits (Ctrl) and the rabbits with heart failure (HF). (E) Typical example and schematic explanation of an ammonium prepulse. (F) Typical examples of effects of Na+-free conditions and cariporide on the acid load recovery in HEPES-buffered conditions.

