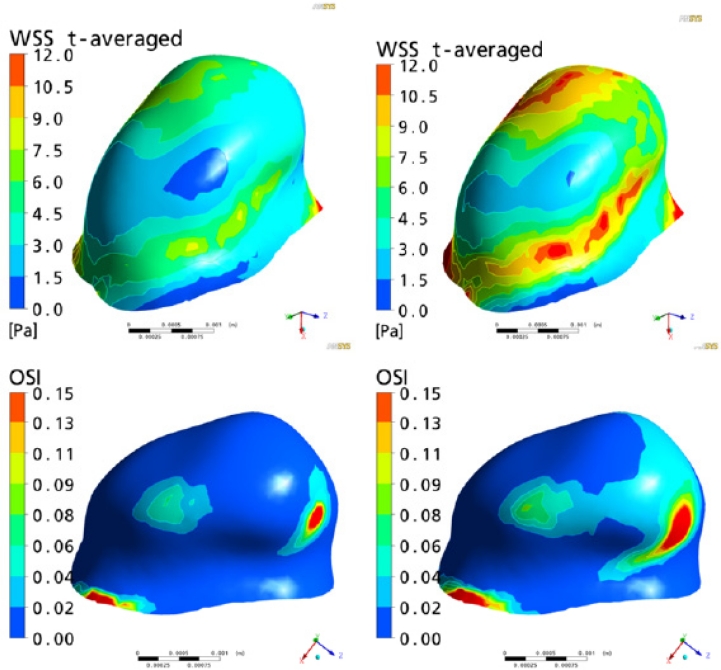
Figure 4:
Time-averaged WSS (top) and OSI (Oscillatory shear index) (bottom) contour plots in the left subclinoid intracranial aneurysm of the CoA patient. Whereas, areas affected by high WSS are increased in CoA patient (top, right) as compared with healthy volunteers (top, left) OSI patterns are minimally changed.

