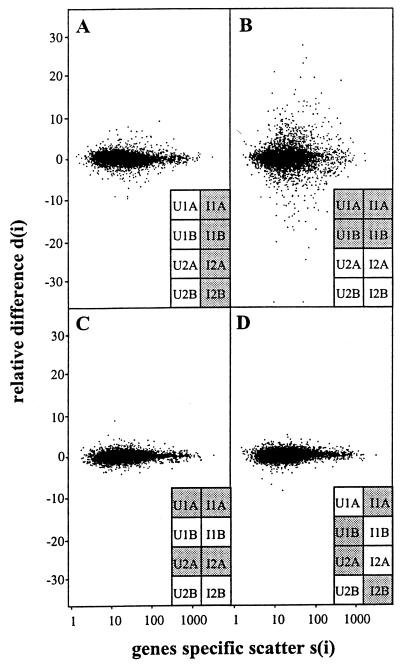
Figure 2.
Scatter plots of relative difference in gene expression d(i) vs. gene-specific scatter s(i). The data were partitioned to calculate d(i), as indicated by the bar codes. The shaded and unshaded entries were used for the first and second terms in the numerator of d(i) in Eq. 1. (A) Relative difference between irradiated and unirradiated states. The statistic d(i) was computed from expression measurements partitioned between irradiated and unirradiated cells. (B) Relative difference between cell lines 1 and 2. The statistic d(i) was computed from expression measurements partitioned between cell lines 1 and 2. (C) Relative difference between hybridizations A and B. The statistic d(i) was computed from the permutation in which the expression measurements were partitioned between the equivalent hybridizations A and B. (D) Relative difference for a permutation of the data that was balanced between cell lines 1 and 2.

