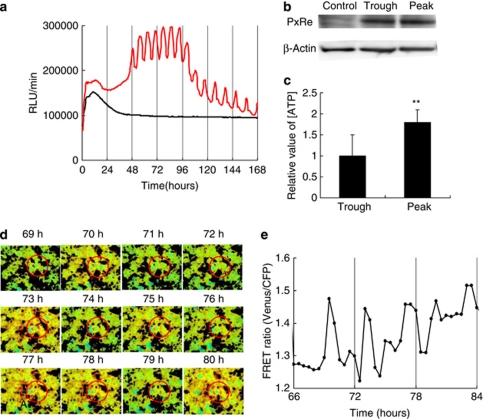
Figure 1.
ATP oscillations are generated in chondrogenesis of ATDC5 cells. (a) Bioluminescence monitoring of PACTIN-PxRe activity in ATDC5 cells after changing the maintenance medium (black line) or the insulin-implemented medium (red line). (b) Protein expression levels of PxRe and β-actin at a trough and a peak of PACTIN-PxRe oscillations. Control: untransfected cells. (c) Relative value of ATP concentration at peak points and trough points of PACTIN-PxRe oscillations. Data represents the combined results from two independent experiments performed with six samples. (n=6, paired t test, **P<0.01). (d and e) Monitoring of cytoplasmic ATP level using a FRET-based ATP sensor. (d) Sequential images of the YFP/CFP emission ratio from 69 to 80 h after chondrogenic induction and (e) the time course of the YFP/CFP emission ratio inside the red circle from 66 to 84 h after chondrogenic induction

