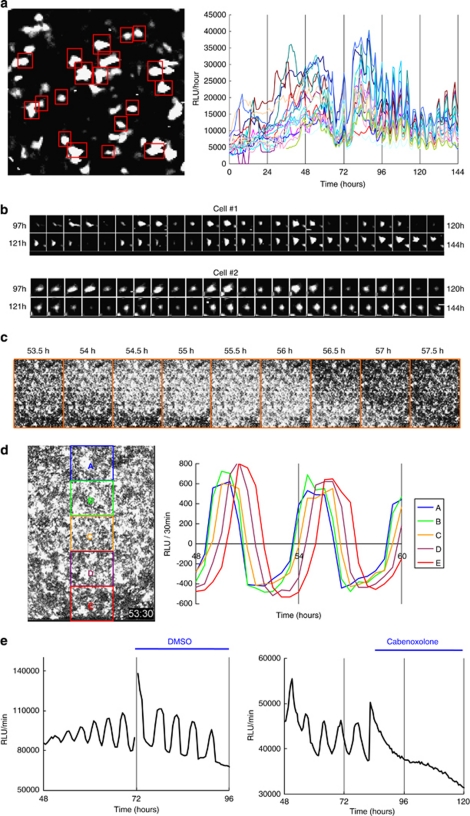
Figure 2.
ATP oscillations are synchronized via gap junctions among ATDC5 cells in chondrogenesis. (a and b) Bioluminescence imaging at the single-cell level shows that PACTIN-PxRe intensities in individual cells start to oscillate collectively by intercellular synchronization during chondrogenesis. (a) Time course data of PACTIN-PxRe intensities of individual cells indicated by red squares after chondrogenic induction. (b) Sequential images of PACTIN-PxRe intensities in representative cells at 1-h intervals from 97 to 144 h after chondrogenic induction. (c and d) Bioluminescence imaging at a low magnification shows that synchronized oscillations of PACTIN-PxRe intensities propagate as intercellular waves during chondrogenesis. (c) Sequential images of PACTIN-PxRe intensities at 30 min intervals from 53.5 to 57.5 h after chondrogenic induction. (d) Detrended data of time course of PACTIN-PxRe intensities in individual areas indicated by coloured squares from 48 to 60 h after chondrogenic induction. (e) Effect of carbenoxolone treatment on PACTIN-PxRe oscillations during chondrogenesis

