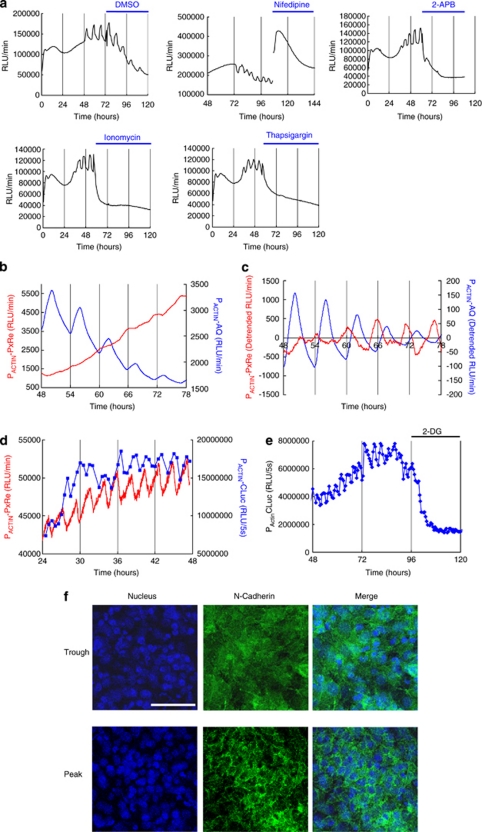
Figure 4.
ATP oscillations are driven by Ca2+ oscillations, leading to oscillatory secretion in chondrogenesis of ATDC5 cells. (a) Effects of nifedipine, 2-APB, ionomycin, and thapsigargin treatment on insulin-induced PACTIN-PxRe oscillations. Time course analysis from (b) the raw data and (c) the detrended data taken with simultaneous monitoring of PACTIN-PxRe intensity (red line) and PACTIN-AqBl intensity (blue line) during chondrogenesis. (d) Time course data taken with simultaneous monitoring of PxRe intensity (red line) and secreted CLuc intensity (blue line) during perfusion with insulin-implemented medium. (e) Effect of 2-DG treatment on the oscillatory secretion of CLuc during perfusion with insulin-implemented medium. (f) Immunofluorescent staining of N-cadherin (green) at the peak and the trough of PxRe oscillations. Nuclei are stained blue by Hoechst 33342. Scale bars, 100 μm

