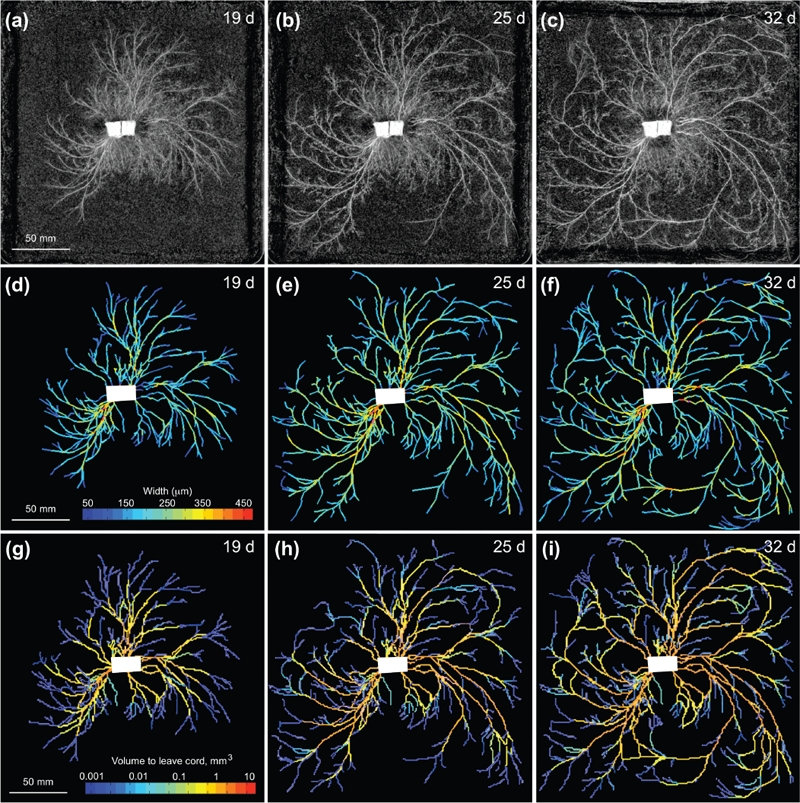
Fig. 2.

Network development and currents predicted by the mathematical model in Phabaerochaete velutina. (a) – (c) Network development in P. velutina after 19, 25 and 32 d. The image intensity of cords was used to estimate their thickness, enabling the production of the weighted, digitized networks (d) – (f). These are colour-coded to show the estimated thicknesses of all sections of all edges. Images (g) – (i) are colour coded according to the total volume that has passed through each cord, as calculated by our model. Supplied by Luke Heaton.
