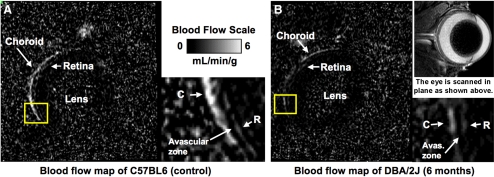
Figure 2.
Calculated BF maps at a resolution of 42 × 42 × 400 μm on a scale of 0 to 6 mL/min/g. (A) BF map of a C57BL/6 control mouse. BF maps resolve choroidal and retinal vascular layers with the avascular zone between. (white arrowheads) Region of the retina used typically for BF analysis. (B) BF map of a 6-month-old DBA/2J mouse, which has lower choroidal and retinal BF. (Anatomic image from another animal shows scan orientation.)

