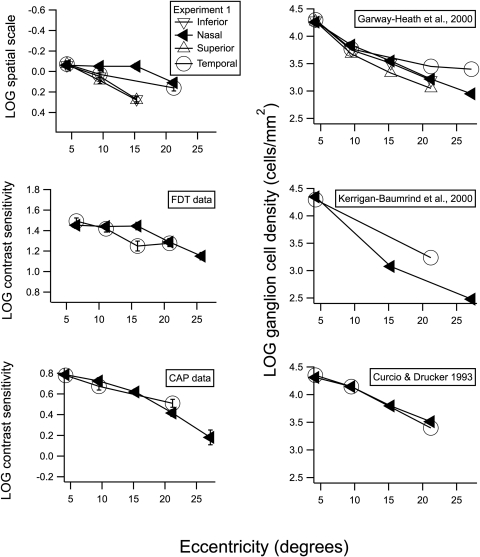
Figure 4.
Spatial scale, contrast sensitivity, and ganglion cell density as a function of eccentricity in degrees of visual angle. (◀) Results for nasal visual field and temporal retina; (○) results for the temporal visual field and nasal retina. For our perimetric data in the graphs on the left, the size of the symbols was selected to represent approximately ±1 SEM. The top graphs include additional data on spatial scale and ganglion cells for superior visual field (inferior retina) and for the inferior visual field (superior retina). The graphs on the right show change in ganglion cell density with eccentricity for three human studies.24,26,27

