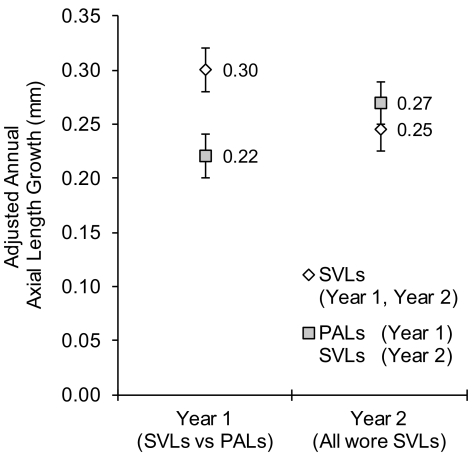
Figure 3.
Mean 1-year change in axial length during year 1 (randomly assigned to PALs or SVLs) and during year 2 (all wore SVLs). Change in axial length is adjusted for baseline age, sex, ethnicity, baseline axial length, baseline steep keratometry, and baseline outdoor activity. Error bars represent SE.

