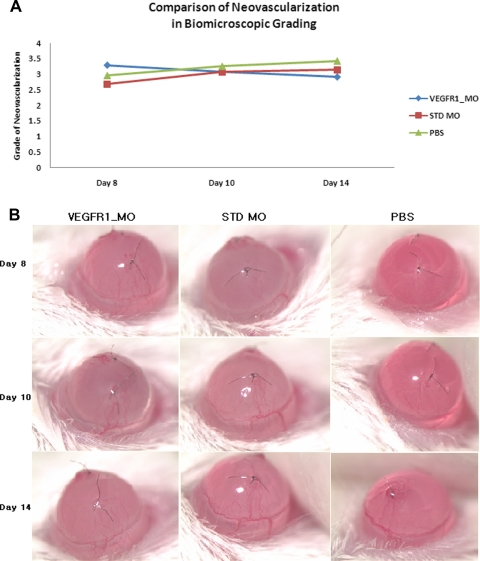
Figure 3.
Comparison of in vivo neovascularization by grading. (A) Comparison of the grade of neovascularization in each of the three groups on days 8, 10, and 14 after suture placement. Regression of neovascularization was seen in the Flt morpholino group (P = 0.026), whereas the standard morpholino (P = 0.001) and PBS (P = 0.005) groups had an increase in neovascularization. A total of 24 suture sites were graded in the FLT morpholino group, 28 suture sites in the standard morpholino group, and 24 suture sites in the PBS group. (B) Representative images of the murine cornea model treated with Flt morpholino, standard morpholino, and PBS.

