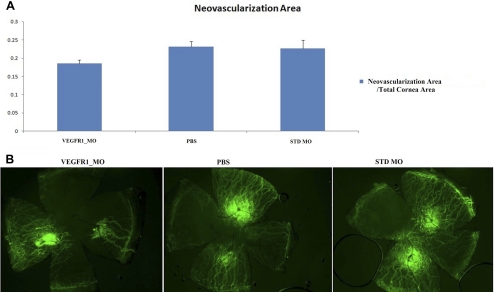
Figure 4.
Comparison of neovascularization area. (A) Comparison of the neovascularized area of each treatment group. The Flt morpholino group showed a reduced area of neovascularization compared with the PBS group (P = 0.019). Twelve corneas in the Flt morphoino group, 14 corneas in the standard morpholino group, and 12 corneas in the PBS group were compared. (B) Representative pictures of corneal neovascularization in each group using fluorescent microscopy.

