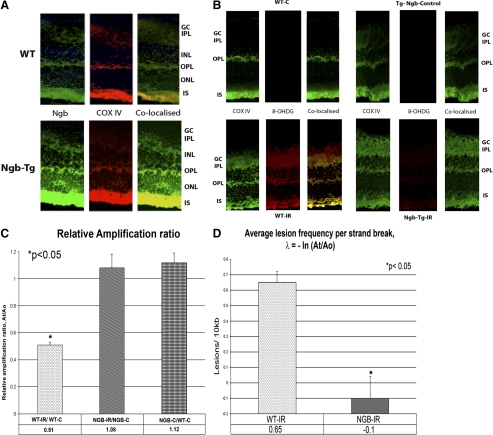
Figure 3.
(A) Localization of Ngb (green) with mitochondrial marker, COX IV (red) in WT mice and Ngb-Tg mice. Ngb protein is localized in the inner segments (IS) of the photoreceptors, outer plexiform layer (OPL), inner plexiform layer (IPL), and ganglion cell (GC) layers, and is colocalized with the mitochondria distribution (COX IV) in the retina. (B) Immunostaining for 8-OHDG, a well recognized marker of oxidative DNA damage. 8-OHDG immunostaining demonstrating DNA damage and oxidative stress was localized in the GCL, INL, ONL, and photoreceptors of WT mice with ischemia (WT-IR). In contrast, no staining for 8-OHDG was detected in Ngb-Tg with IR indicating the absence of DNA damage and oxidative stress in these mice. Colocalization of 8-OHDG with a mitochondrial marker, COX IV demonstrates that the oxidative stress is in the mitochondria. (C) Measurement of mitochondrial DNA damage using quantitative PCR. The relative amplification of the 10 kb mitochondrial fragment comparing the amplicon amounts of NGB-IR/NGB-C and WT-IR/WT-C after normalizing with the 117 bp small mitochondrial fragment revealed a 52.8% decrease (*P < 0.05) in relative amplification ratio between WT-IR and NGB-IR. There was no significant difference between the relative amplification ratio of NGB-C/WT-C mice without ischemia and NGB-IR/NGB-C mice with ischemia. Results are expressed as mean ± SEM values for three QPCRs performed for each DNA per group, n = 6 mice per group. *P ≤ 0.05 was considered significant. (D) Decreased mitochondrial lesions in Ngb-Tg mice with IR. Average mitochondrial DNA damage per 10 kb DNA revealed a significant decrease in mitochondrial lesions (−0.1 lesion/10 kb, *P < 0.05) in Ngb-Tg mice with ischemia (NGB-IR) in comparison with WT mice with ischemia (WT-IR). The average lesion frequency per strand can be calculated as λ = −lnAt/Ao, where At represents the amount of amplification of the damaged template and Ao is the amount of amplification product from undamaged DNA. The amplification of At is also normalized to the amplification of Ao and expressed as the relative amplification ratio, At/Ao. Statistical analysis was performed with Student's t-test with *P < 0.05 considered significant.

