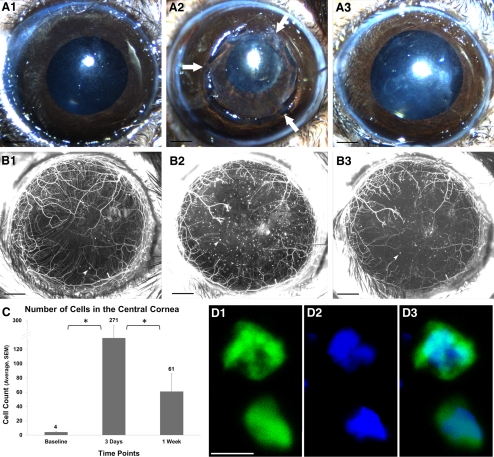
Figure 1.
Inflammatory cell influx after lamellar corneal surgery. (A1–A3) Color images of a cornea before surgery (A1), immediately after surgery (A2; arrows point to flap hinges), and 1 week after surgery showing uncomplicated healing (A3). (B1–B3) In vivo maximum intensity projection image of fluorescent nerves and inflammatory cells in thy1-YFP mouse cornea before surgery (B1), 3 days after surgery (B2), and 1 week after surgery (B3). Black scale bar, 500 μm. Arrowheads point to YFP-positive inflammatory cells. (C) Quantification of YFP-positive cells, which peaked at day 3. *P < 0.05. (D) Confocal microscope image of thy1-YFP+ cells (thy1 is a pan T-cell marker in mice20). The nucleus is stained blue with DAPI. The YFP+ cells are approximately 12 μm in size (D1), with a large nucleus (D2) characteristic of bone marrow–derived cells of lymphoid lineage. White scale bar, 10 μm.

