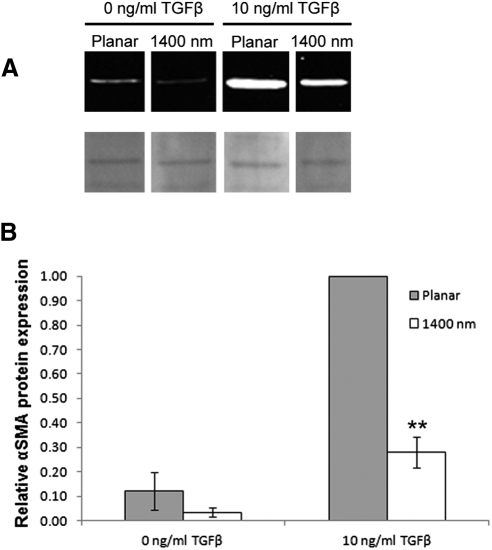
Figure 3.
αSMA protein is reduced in corneal stromal cells cultured on 1400 nm pitch compared with planar surfaces. (A) Western blot analysis of lysates from cells cultured on surfaces and media as shown (top row); Ponceau S band used for semiquantitative normalization shown below blots. Images are from the same blot reordered for clarity. (B) Graph indicating normalization of αSMA protein signal intensities; signal is significantly reduced on 1400 nm compared with adjacent planar control. Error bars indicate SEM. **P < 0.01.

