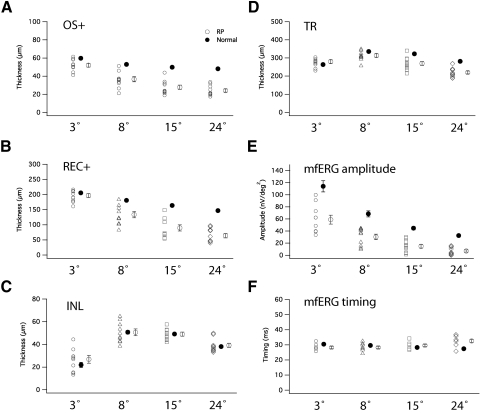
Figure 3.
(A–D) Scatter plots of thicknesses of OS+, REC+, INL, and TR measured in central 3°, 3°–8°, 8°–15°, and 15°–24°. Filled symbols, normal individuals. Open symbols, patients with RP. Average values (larger symbols) with SE are shown to the right of the group of plots. (A) OS+ thicknesses in patients with RP were significantly shorter than normal in all loci. (B) REC+ thicknesses in patients with RP were significantly shorter than normal in all loci except the central 3°. (C) INL thickness did not differ in patients versus normal control. (D) TR thickness was not shorter than normal in the central 3° and 3°–8°, but was shorter in two other loci. (E–F) MfERG amplitude and implicit time in patients with RP and normal controls. MfERG amplitudes in RP were shorter than normal in all four loci, but longer than normal implicit time in RP was limited to 15°–24°.

