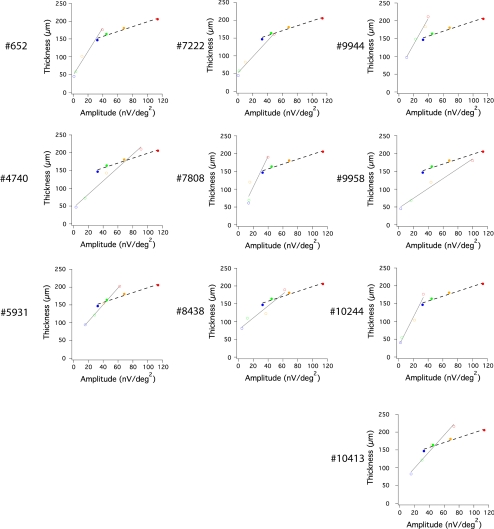
Figure 5.
Significant correlation between REC+ thickness and mfERG amplitude in corresponding loci (color-coded) in each of the 10 patients with RP (unfilled symbols). Gray lines represent linear fit to these correlations in patients; black broken lines show linear fit to normal average (filled symbols). Red, central 3°; yellow, 3°–8°; green, 8°–15°; blue, 15°–24°.

