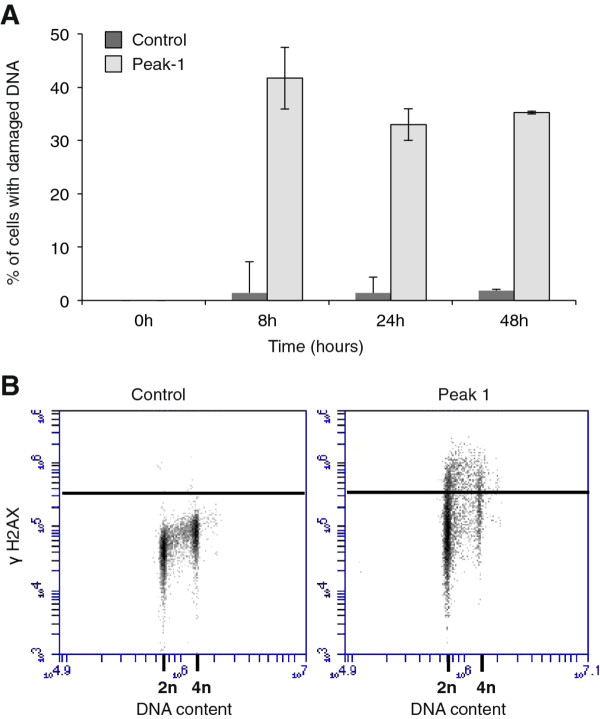
Figure 5.
The kinetics of peak 1-induced DNA damage. (A) DNA damage in treated with peak 1 (20 μg/ml) or with for various times up to 48 h. Bars represent the mean of two independent experiments. (B) Bivariate analysis of DNA damage (γH2AX) and DNA content (2n, 4n) after treatment with 20 μg/ml of peak-1 for 24 h.

