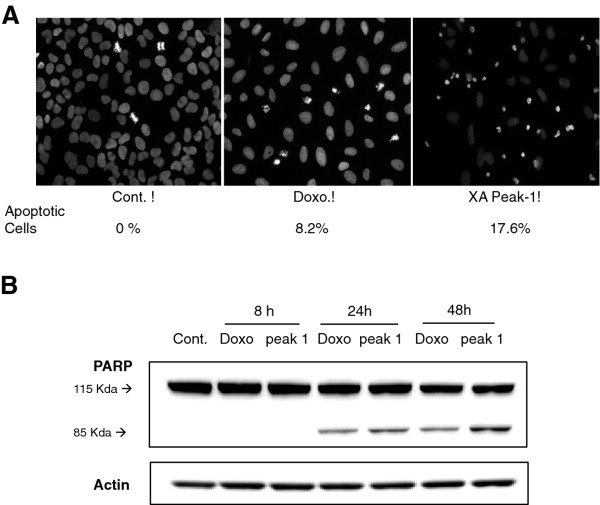
Figure 6.
The apoptosis-inducing effect of peak 1. (A) DAPI staining of U2OS cells after 24 h treatment with peak 1 (20 μg/mL) or 10 nM doxorubicin. The images are representative of three independent experiments. The mean percentage of apoptotic cells is indicated. (B) Western blot analysis of PARP after treatment of U2OS cells with peak 1 (20 μg/ml) or doxorubicin (10 nM) for 8, 24 and 48 h. Full-length 115 kDa PARP and its 85 kDa proteolytic fragment are shown. Actin is presented as a control for equal loading.

