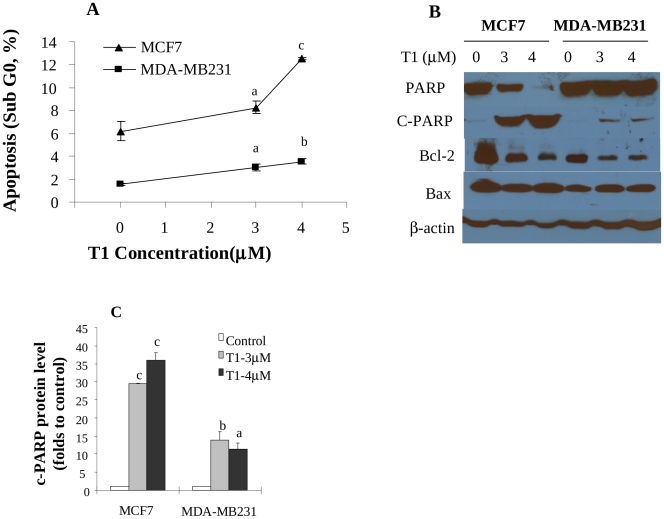
Figure 3. Effects of T1 on apoptosis of breast cancer cells and protein levels of apoptosis-related biomarkers (48h).
A: Effects of T1 on the proportion of DNA fragmentation (sub-G0), a marker of apoptosis, in MCF-7 and MDA-MB231 cell lines. Values were mean±SEM of at least two independent experiments, each in duplicates; B: The representative Western blot images showing the effects of T1 on protein levels of apoptosis related biomarkers PARP, c-PARP, bcl2 and bax; C: Quantitation of c-PARP protein levels in MCF-7 and MDA-MB231 by densitometry after normalization to β-actin. The images for quantitation were from at least two independent experiments. Within the panel, the value with a letter was significantly different from that of the corresponding control, a, p<0.05; b, p<0.01; c, p<0.001.

