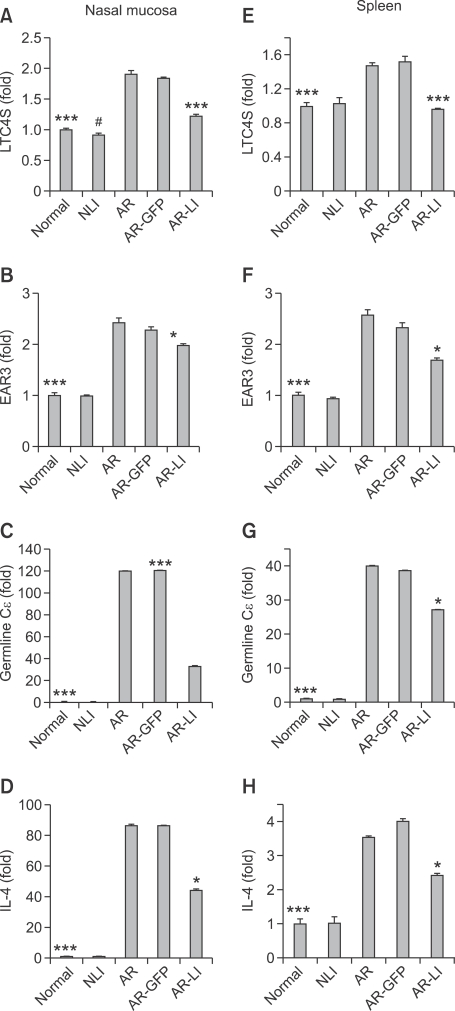
Figure 8.
Real-time RT-PCR analysis of mRNA levels of LTC4S, EAR3, germline Cε, and IL-4 in the nasal mucosa (A-D, respectively) and spleen (E-H, respectively) of the mice. Each value represents the mean ± SEM of each group. *P < 0.05; ***P < 0.001 vs. the AR group; #P < 0.05 vs. normal control group.

