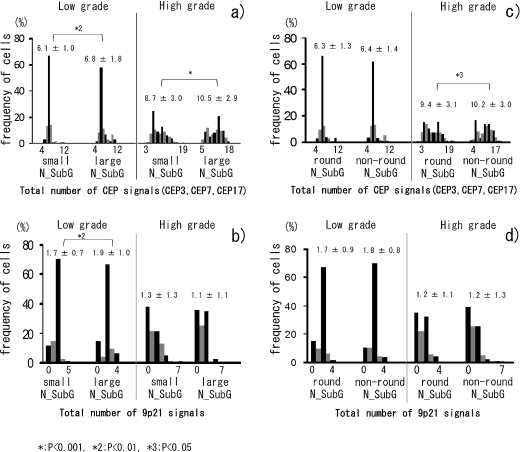
Fig. 3.
a, b) Comparison (between small and large nuclear subgroups (N_SubG) in the low- and high-grade groups) of a) the distribution of the total number of CEP signals (CEPs 3, 7, 17) per cell, and b) the number of 9p21 signals per cell. c, d) Comparison (between round and non-round nuclear subgroups (N_SubG) in low- and high-grade groups) of c) the distribution of the total number of CEP signals (CEPs 3, 7, 17) per cell, and d) the number of 9p21 signals per cell. Value above columns is the mean±SD for each condition.

