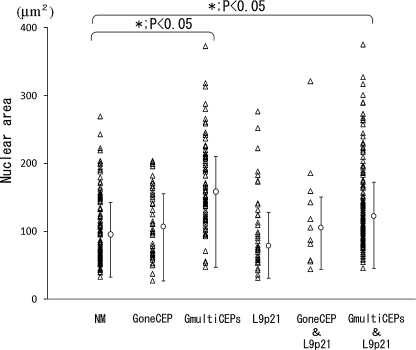
Fig. 4.
Correlation between nuclear area and gain of chromosome or loss of 9p21. A total of 600 cells was grouped by the number of identifiable FISH signals. ‘NM’ denotes normal cells with two signals for each probe; ‘GoneCEP’ denotes cells with gain of one kind of chromosome; ‘GmultiCEPs’ group indicates cells with gains of two or more CEPs; ‘L9p21’ contains those cells exhibiting loss of 9p21 but without any gain of CEPs; ‘GoneCEP & L9p21’ denotes cells with both gain of one kind of CEP and loss of 9p21; and the ‘GmultiCEPs & L9p21’ group of cells exhibit a gain of two or more kinds of CEPs together with the loss of 9p21.

