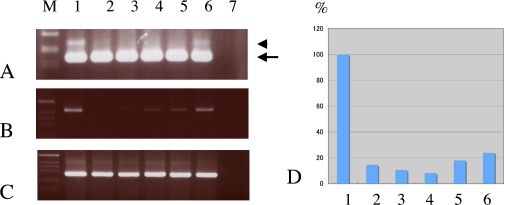
Fig. 3.
RT-PCR (A, B, C) and real time-PCR (D) analyses of Tfg mRNAs and proteins in the rat retina. A: RT-PCR experiment using a primer set for the common region of cTfg and rTfg. A strong band of 170 bp (arrowhead) and a faint band of 211 bp (arrow) correspond well to the sizes of cTfg and rTfg, respectively. B: RT-PCR experiment using a primer set specific for rTfg. A single band of 426 bp is seen. C: RT-PCR experiment using a primer set specific for β-actin. β-actin mRNA was evenly expressed in all tissues examined. D: Real-time PCR demonstrated high expression levels of rTfg mRNA in the brain, and this was normalized to 100%. M indicates a marker. 1; brain, 2; heart, 3; lung, 4; colon, 5; liver, 6; retina.

