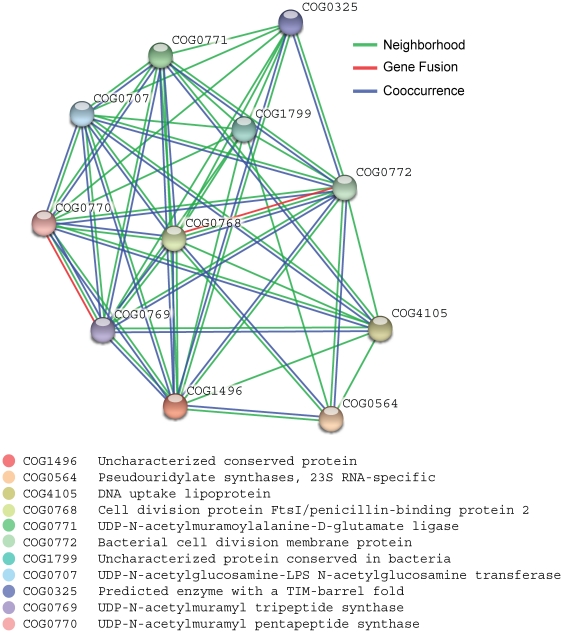
Figure 3. Network of predicted associations for a particular group of proteins, involved in cell wall associated processes (related to COG1496 (containing the hypothetical gene rv2149c (red)).
The network edges represent the predicted functional associations. Any edge may be drawn with up to 3 differently coloured lines; these lines represent the existence of the three types of evidence used in predicting the associations. A red line indicates the presence of fusion evidence; a green line - neighborhood evidence; a blue line – cooccurrence evidence.

