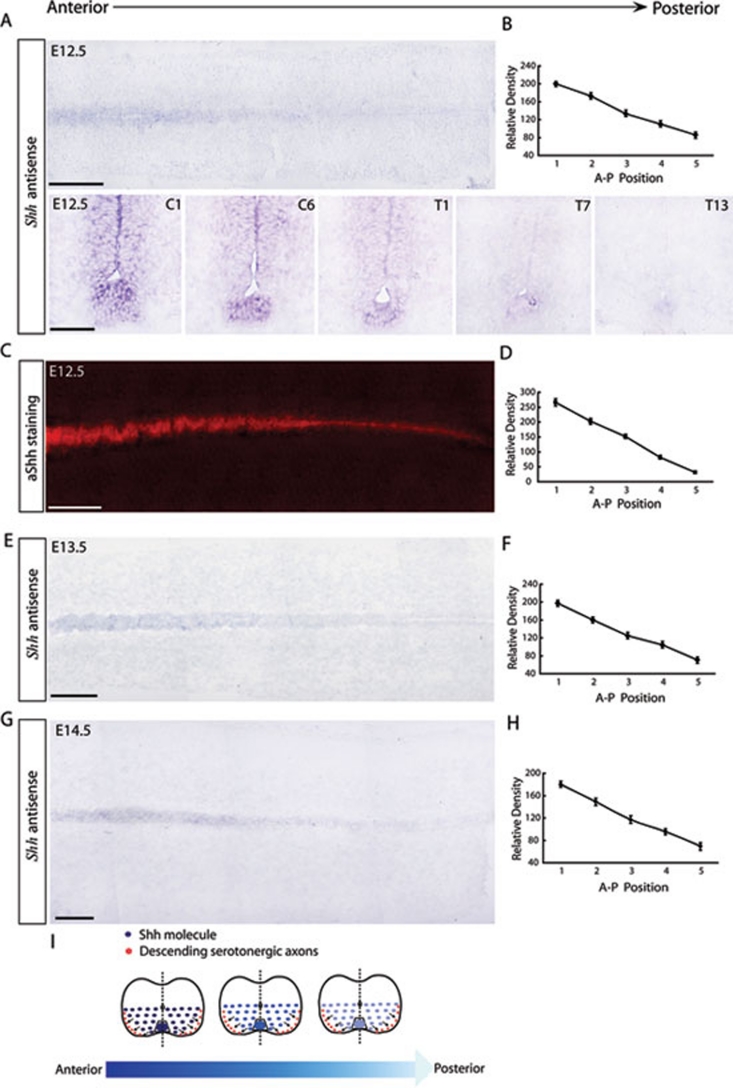
Figure 1.
Shh secreted from the floor plate establishes a decreasing A-P gradient in the developing spinal cord. (A) A 4-5 mm, decreasing A-P gradient of Shh mRNA was detected in the floor plate of E12.5 spinal cords. In situ hybridization with an Shh antisense probe was conducted on one horizontal and a series of coronal sections at intervals of 800 μm. Scale bars: top 500 μm; bottom 50 μm. (B) Quantification of positive signals showed a decreasing A-P gradient of Shh mRNA in the E12.5 spinal cord. (C) Shh secreted from the floor plate formed a 4-5 mm, decreasing A-P gradient in the E12.5 spinal cord. Immunostaining with anti-Shh was conducted using one horizontal section. Scale bar: 500 μm. (D) Quantification of positive signals showed a high-to-low gradient of Shh protein in the A-P direction of E12.5 spinal cords. (E) The decreasing A-P gradient of Shh mRNA was maintained in the floor plate of E13.5 spinal cords. In situ hybridization with an Shh antisense probe was conducted using horizontal sections. Scale bar: 800 μm. (F) Quantification of the positive signals in C showed a sustained, decreasing A-P gradient of Shh mRNA in E13.5 spinal cords. (G) The decreasing A-P gradient of Shh mRNA was maintained in the floor plate of E14.5 spinal cords. In situ hybridization with an Shh antisense probe was conducted on horizontal sections. Scale bar: 1 000 μm. (H) Quantification of the positive signals in E showed a sustained, decreasing A-P gradient of Shh mRNA in E14.5 spinal cords. The relative density of the positive signal was measured by Image J software (NIH). The relative density of each point was averaged from at least three different spinal cords and statistical analysis was performed using the Student's t-test. Results are presented as the mean ± S.E.M. (I) Schematic diagram explaining our hypothesis that an Shh gradient directs the projection of serotonergic RST axons.

