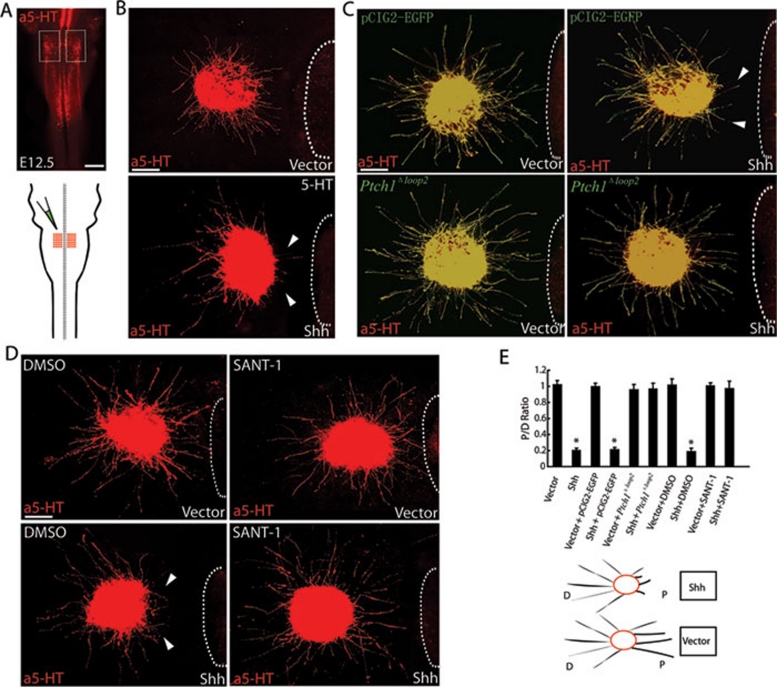
Figure 3.
Diffused Shh repels serotonergic RST axons via Ptch1 and Smo. E12.5 CRN explants were co-cultured with COS1 cell aggregates transfected with empty vectors or Shh expression constructs. (A) Ex utero electroporation of the E12.5 mouse CRN. Whole-mount immunostaining with anti-5-HT was used to identify the E12.5 CRN, from which the serotonergic RST axons originated (shown in the rectangle and the red area of the brainstem diagram). Scale bar: 500 μm. (B) Secreted Shh strongly repelled serotonergic RST axons growing out from the CRN explants. (C) Shh-Ptch1 interactions mediate Shh repulsion of projecting RST axons. Secreted Shh strongly repelled serotonergic RST axons growing from CRN explants that expressed only EGFP. By comparison, secreted Shh had no repulsive effect on serotonergic RST axons expressing Ptch1Δloop2. White arrowheads indicate deflected axons. White dashed lines outline the boundary of cell aggregates. Scale bar: 200 μm. (D) Derepression of Smo mediates Shh repulsion of projecting RST axons. Secreted Shh strongly repelled serotonergic RST axons growing from the CRN explants. This repulsion was effectively interrupted by adding SANT-1. White arrowheads indicate deflected axons. White dashed lines outline the boundary of cell aggregates. Scale bar: 200 μm. (E) Quantification of axon outgrowth in the cell aggregate assay. The repulsion of serotonergic RST axons caused by secreted Shh was mediated by Ptch1 and Smo receptors. The P/D ratio was taken as a measure of axon outgrowth. The experiment was replicated at least five times. Statistical analysis was performed using the Student's t-test. Results are presented as the mean ± S.E.M. (n ≥ 5). Asterisks indicate values that differ significantly from values in the control groups (P < 0.05). Vector group: 1.018 ± 0.056; Shh group: 0.198 ± 0.078; Vector + pCIG2 group: 0.993 ± 0.048; Shh + pCIG2 group: 0.209 ± 0.029; Vector + Ptch1Δloop2 group: 0.958 ± 0.065; Shh + Ptch1Δloop2 group: 0.966 ± 0.072; Vector + DMSO group: 1.013 ± 0.082; Shh + DMSO group: 0.186 ± 0.045; Vector + SANT-1 group: 1.006 ± 0.038; Shh + SANT-1 group: 0.986 ± 0.091.

