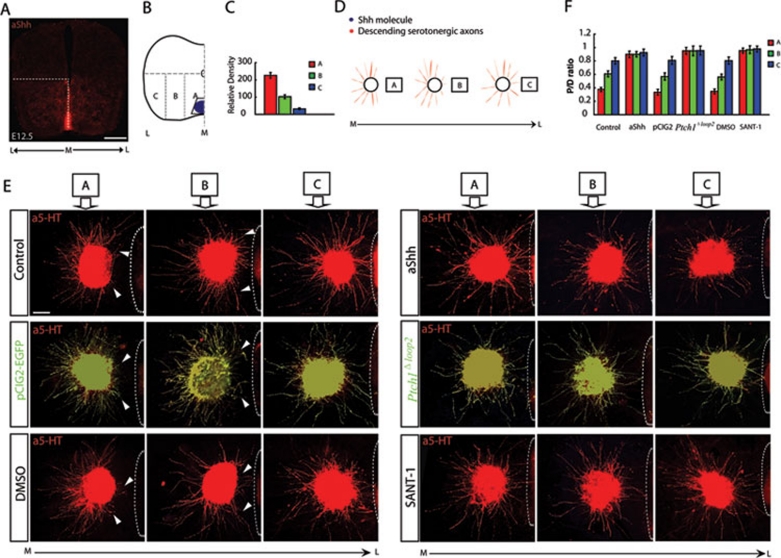
Figure 5.
M-L graded repulsion is mediated by Shh signaling. (A) The decreasing Shh gradient in the M-L direction was shown by immunostaining for Shh in coronal sections of the E12.5 upper cervical spinal cord (outlined by the dashed line). Scale bar: 200 μm. (B) The ventral spinal cord is outlined as part A, B and C in the M-L direction. (C) Quantification of positive immunostaining signals in the A, B and C areas showed a decreasing M-L gradient of Shh in the E12.5 ventral spinal cord. (D) Schematic depiction of the M-L graded assay. Three explants (A, B and C) were dissected from the ventral spinal cord in the M-L direction and individually co-cultured with the ipsilateral CRN. After culture, immunostaining with anti-5-HT was used to confirm that descending serotonergic RST axons were growing from the CRN explants. (E) Decreasing M-L repulsion of serotonergic RST axons was detected clearly in the ventral spinal cord by the M-L graded assay. This graded repulsion was abolished effectively when the Shh antibody (5E1) or SANT-1 was added to the co-culture system or when Ptch1Δloop2 was expressed in serotonergic RST axons by co-culturing the Ptch1Δloop2-electroporated CRN with the explants from the ventral spinal cord. White arrowheads indicate deflected axons. White dashed lines outline the boundary of the explant from the ventral spinal cord (A, B and C). Scale bar: 200 μm. (F) Quantification of axon outgrowth in the M-L graded assay. Axon outgrowth was measured by the P/D ratio. M-L graded repulsion was abolished after the Shh signaling components were blocked individually. The experiment was replicated at least five times. Statistical analysis was performed using the Student's t-test. Results are presented as the mean ± S.E.M. Control group: 0.376 ± 0.03; 0.608 ± 0.045; 0.801 ± 0.047; Shh antibody group: 0.897 ± 0.050; 0.899 ± 0.039; 0.924 ± 0.056; pCIG2-EGFP group: 0.335 ± 0.049; 0.569 ± 0.054; 0.808 ± 0.058; Ptch1Δloop2 group: 0.953 ± 0.053; 0.949 ± 0.070; 0.955 ± 0.070; DMSO group: 0.347 ± 0.036; 0.562 ± 0.040; 0.805 ± 0.052; SANT-1 group: 0.956 ± 0.036; 0.968 ± 0.056; 0.979 ± 0.044.

