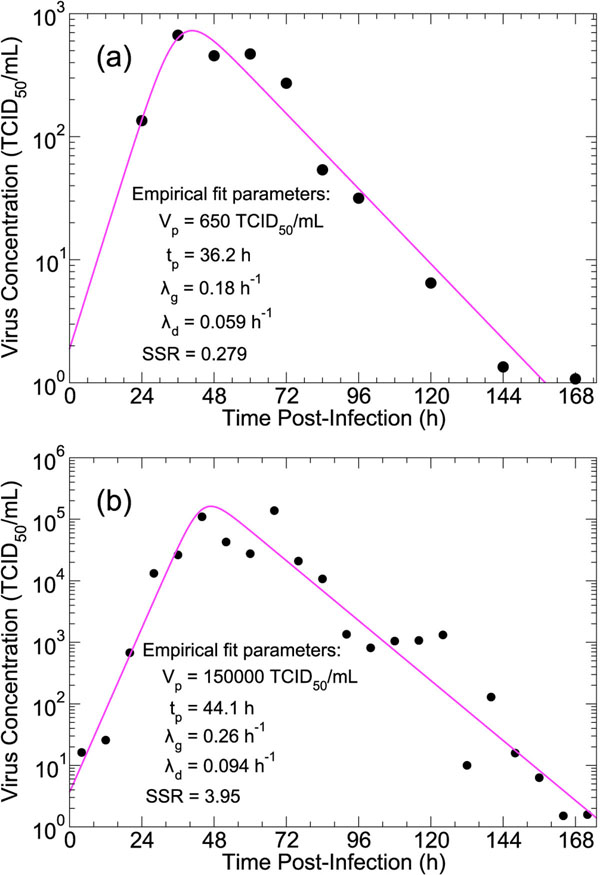
Figure 6.
In vivo patient data. Viral titer over time for volunteer patients infected with (a) influenza A/Texas/36/91 (H1N1) [38], and (b) A/Bethesda/1/85 (H3N2) [39]. The solid curve is a fit of the empirical model in Equation (11) to each dataset. The fitted parameter values are given along with the SSR of the fit.

