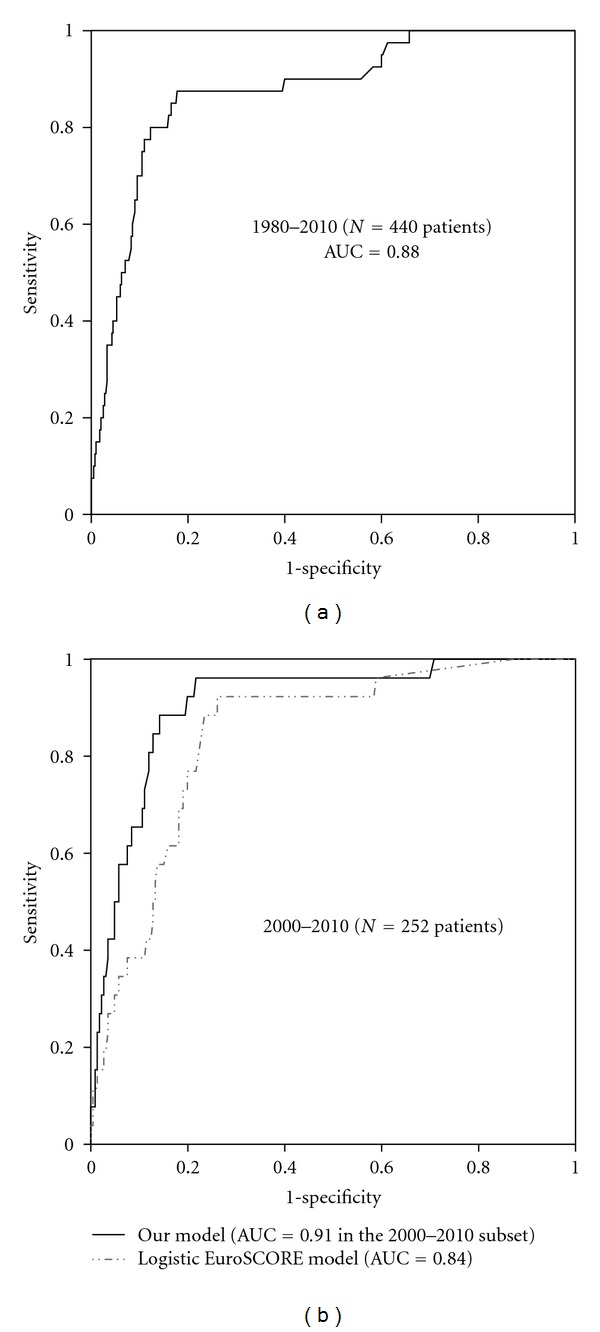
Figure 1.

(a) Receiver-operator characteristic (ROC) curve for our logistic regression model developed from the analysis of 440 native valve IE patients: note the high value of the AUC, also compared to the one reported in the EuroSCORE development study (0.78 [8]); (b) ROC curves for our logistic regression model and the logistic EuroSCORE in the subpopulation (2000–2010) for whom EuroSCORE data were available; AUC: area under the curve.
