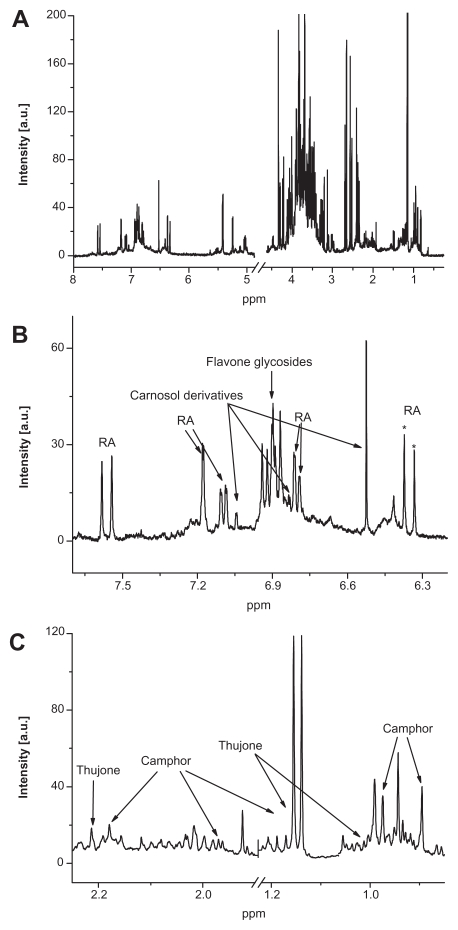
Figure 1.
1H NMR spectrum of sage tea in the whole δ 8.0–0.0 ppm range (A), as well as magnifications in the aromatic region (B) and aliphatic region (C) with assignments of compounds of interest. Stars denote the resonances of rosmarinic acid (RA) that were used for quantification (no overlap with other constituents).

